

February 6, 2017
ANALYSIS OF BBNI, BANK NEGARA INDONESIA (PERSERO) TBK PT
For this stock, we will analyze from monthly, weekly, and daily timeframe to get the trend or movement tendency.
TREND ANALYSIS

BBNI MONTHLY TREND (UP)
Despite the current price still far from the latest high, the trend of BBNI after its low is growing. We can see that the candlestick is producing new Higher Low (HL) which means it is having new consolidation area within the periods. We can expect the price will continue its growing trend for the upcoming months.

BBNI MONTHLY TREND (UP)
If we look at the weekly trend with focusing and zooming the monthly uptrend movement, Higher High (HH) and Higher Low (HL) forms implying that the price can still increasing.
Right now, with the increased price from Low and form HH, we need to confirm the HL. If the price continuing its uptrend and passes the current HH, the assuming HL will be confirmed as the real, new HL.

BBNI DAILY TREND (SIDEWAYS, TENDENCY TO UP IN SHORT TERM)
If we see at daily trend, the candlestick pattern was sideways with many consecutive up days and consecutive down days and good for swing trader. However, the price has a tendency to bullish in the upcoming week because of the forming of Morning Doji Star at the end of January and the first of February.
One thing to be watch of is that after its bullish, the price probably will have another consecutive down days. So, we should be discipline and take profit after short-term-target is achieved.
WHOLE TREND OF BBNI
Using candlestick, the monthly, weekly, and daily trend of BBNI imply that the price has tendency to uptrend. To ensure the upcoming movement of the price, we can use Support and Resistance (SR) analysis. However, because of the limitation of historical data, we will only using weekly and daily basis of analysis
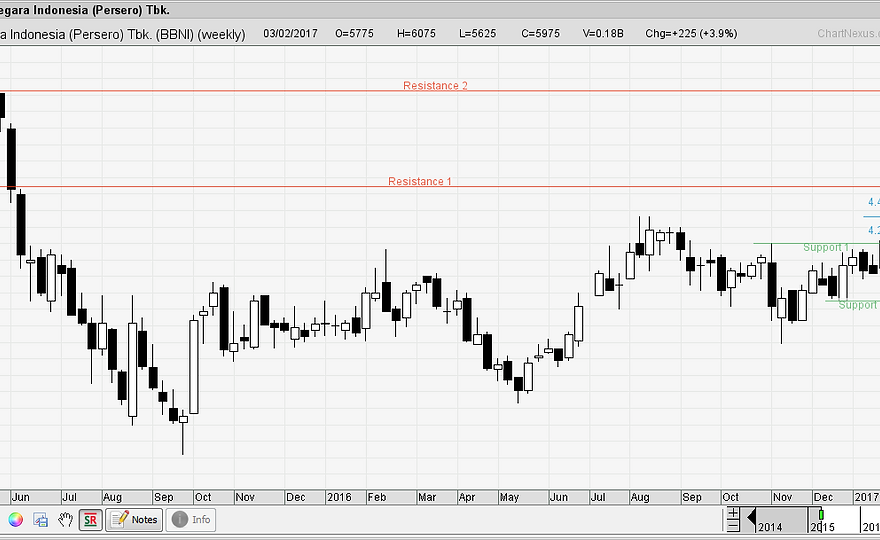
WEEKLY SR OF BBNI
If we see the SR chart on weekly basis, we can see that the price had broke the previous consolidation area (Support: 5200, Resistance: 5725) and have made new consolidation area (Support: 5725, Resistance 6250). However with the similar range between both current price-support and current price-resistance, the change of price on weekly basis will be about 6050 and 5975. To see the tendency of price movement more specific, we can see on daily basis

DAILY SR OF BBNI
On daily basis, we can see that the support is slightly higher (5875) that makes the range between current price and support narrower while between current price and resistance wider. More specific, the current price probably will still going up trying to break the resistance.

RE-CAP OF SUPPORT AND RESISTANCE
On weekly basis, the price is almost the middle of the consolidation area. To see the tendency of movement, daily basis graphs that the price still have possibility to increase. Next, we will continue the analysis using stochastic and volume indicator to analyze BBNI more detail.
ANALYSIS USING STOCHASTIC AND VOLUME INDICATOR

WEEKLY TIMEFRAME ANALYSIS (CONTINUE STRENGTHENING WITH ITS TRANSACTION VOLUME)
Although that the range between support-current price-resistance is similar, the volume of transaction is growing positively (more buy than sell). It indicates that the volume still have power to push the price upright. However, the stochastic reaches 80% that indicates overbought point that we must be cautious of.

DAILY TIMEFRAME ANALYSIS (PROFIT TAKING TENDENCY)
In contrast, daily timeframe indicates that the volume is decreasing and the momentum already at overbought point. With these two indicators, the price will hard to go further from 6100 and in short term will be hard to break the resistance point.
MULTI-TIMEFRAME ANALYSIS
MULTI-TIMEFRAME ANALYSIS
Let’s summary our findings through the indicators:
1.Overall from all timefrime, the tendency of the price still uptrend
2.Support and Resistance from weekly and daily basis have been identified with the tendency to change sideways in the current consolidation area
3.Volume on daily basis indicates the price will be difficult to go up further, while on weekly basis, the price still can go up to test the resistance
4.Momentum both daily and weekly basis has reach 80%, meaning that the stock already in the level of overbought.
We predict that the price will still continue strengthening. However, we must say that the safest point is at 6100 because of the stochastic depicts overbought.
RECOMMENDATION
"WE RECOMMEND FOR THE HOLDERS OF BBNI TO HOLD THE STOCK AND SELL AT 6100. IF LATER THE PRICE STILL GO UP AND BREAK THE RESISTANCE, WE CAN BUY IT BACK."
TO GET AN OVERVIEW ABOUT OUR INVESTMENT PORTFOLIO, PLEASE SEE THE IMAGES BELOW TO FIND OUT:

DANAWANG INITIAL PORTFOLIO STATUS AND ASSETS VALUE
